#ifndef CPLOT1_H
#define CPLOT1_H
#include <QtWidgets/QMainWindow>
#include <QtMath>
#include "ui_cplot1.h"
#include "qcustomplot.h"
class cplot1 : public QMainWindow
{
	Q_OBJECT
public:
	cplot1(QWidget *parent = 0);
	~cplot1();
	void draw();
private:
	Ui::cplot1Class ui;
	QCustomPlot *customPlot;
};
#endif // CPLOT1_H
#include "cplot1.h"
#include <QVector>
cplot1::cplot1(QWidget *parent)
: QMainWindow(parent)
{
ui.setupUi(this);
this->setCentralWidget(ui.widget);
customPlot =ui.widget;
draw();
}
cplot1::~cplot1()
{}
void cplot1::draw()
{
//图例
customPlot->setLocale(QLocale(QLocale::English, QLocale::UnitedKingdom));
customPlot->legend->setVisible(true);
QFont legendFont = font();
legendFont.setPointSize(9);
customPlot->legend->setFont(legendFont);
customPlot->legend->setBrush(QBrush(QColor(255, 255, 255, 200)));
customPlot->axisRect()->insetLayout()->setInsetAlignment(0, Qt::AlignBottom | Qt::AlignRight);
//图0
customPlot->addGraph(customPlot->yAxis, customPlot->xAxis);
customPlot->graph(0)->setPen(QPen(QColor(255, 100, 0)));
customPlot->graph(0)->setLineStyle(QCPGraph::lsLine);
customPlot->graph(0)->setScatterStyle(QCPScatterStyle(QCPScatterStyle::ssDisc, 5));
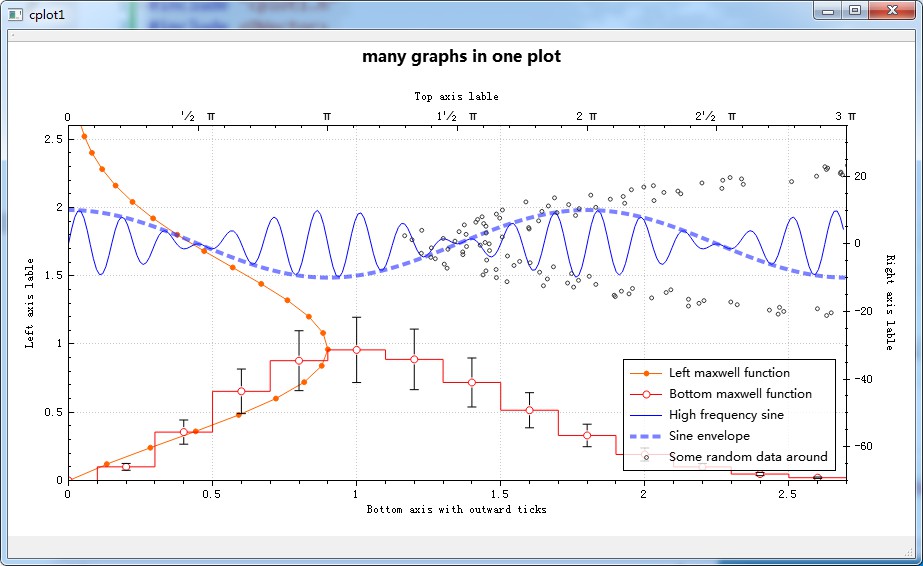
customPlot->graph(0)->setName("Left maxwell function");
//图1
customPlot->addGraph();
customPlot->graph(1)->setPen(QPen(Qt::red));
customPlot->graph(1)->setLineStyle(QCPGraph::lsStepCenter);
customPlot->graph(1)->setScatterStyle(QCPScatterStyle(QCPScatterStyle::ssCircle, Qt::red, Qt::white, 7));
customPlot->graph(1)->setName("Bottom maxwell function");
QCPErrorBars *errorBars = new QCPErrorBars(customPlot->xAxis, customPlot->yAxis);
errorBars->removeFromLegend();
errorBars->setDataPlottable(customPlot->graph(1));
//图2
customPlot->addGraph(customPlot->xAxis2, customPlot->yAxis2);
customPlot->graph(2)->setPen(QPen(Qt::blue));
customPlot->graph(2)->setName("High frequency sine");
//图3
customPlot->addGraph(customPlot->xAxis2, customPlot->yAxis2);
QPen blueDotPen;
blueDotPen.setColor(QColor(30, 40, 255, 150));
blueDotPen.setStyle(Qt::DotLine);
blueDotPen.setWidthF(4);
customPlot->graph(3)->setPen(blueDotPen);
customPlot->graph(3)->setName("Sine envelope");
//图4
customPlot->addGraph(customPlot->yAxis2, customPlot->xAxis2);
customPlot->graph(4)->setPen(QColor(50, 50, 50, 255));
customPlot->graph(4)->setLineStyle(QCPGraph::lsNone);
customPlot->graph(4)->setScatterStyle(QCPScatterStyle(QCPScatterStyle::ssCircle, 4));
customPlot->graph(4)->setName("Some random data around");
//数据
QVector<double> x0(25), y0(25);
QVector<double> x1(15), y1(15), ylerr(15);
QVector<double> x2(250), y2(250);
QVector<double> x3(250), y3(250);
QVector<double> x4(250), y4(250);
for (int i = 0; i < 25; i++)
{
x0[i] = 3 * i / 25.0;
y0[i] = qExp(-x0[i] * x0[i] * 0.8)*(x0[i] * x0[i] + x0[i]);//e^v
}
for (int i = 0; i < 15; i++)
{
x1[i] = 3 * i / 15.0;
y1[i] = qExp(-x1[i] * x1[i])*(x1[i] * x1[i])*2.6;
ylerr[i] = y1[i] * 0.25;
}
for (int i = 0; i < 250; i++)
{
x2[i] = i / 250.0 * 3 * M_PI;
x3[i] = x2[i];
x4[i] = i / 250.0 * 100 - 50;
y2[i] = qSin(x2[i] * 12)*qCos(x2[i]) * 10;
y3[i] = qCos(x3[i]) * 10;
y4[i] = 0.01*x4[i] * x4[i] + 1.5*(rand() / (double)RAND_MAX - 0.5) + 1.5*M_PI;
}
customPlot->graph(0)->setData(x0, y0);
customPlot->graph(1)->setData(x1, y1);
errorBars->setData(ylerr);
customPlot->graph(2)->setData(x2, y2);
customPlot->graph(3)->setData(x3, y3);
customPlot->graph(4)->setData(x4, y4);
customPlot->xAxis2->setVisible(true);
customPlot->yAxis2->setVisible(true);
customPlot->xAxis->setRange(0, 2.7);
customPlot->yAxis->setRange(0, 2.6);
customPlot->xAxis2->setRange(0, 3.0 * M_PI);
customPlot->yAxis2->setRange(-70, 35);
customPlot->xAxis2->setTicker(QSharedPointer<QCPAxisTickerPi>(new QCPAxisTickerPi));
customPlot->plotLayout()->insertRow(0);
customPlot->plotLayout()->addElement(0, 0, new QCPTextElement(customPlot, "many graphs in one plot", QFont("Microsoft Yahei", 12, QFont::Bold)));
customPlot->xAxis->setLabel("Bottom axis with outward ticks");
customPlot->yAxis->setLabel("Left axis lable");
customPlot->xAxis2->setLabel("Top axis lable");
customPlot->yAxis2->setLabel("Right axis lable");
customPlot->xAxis->setTickLength(0, 5);
customPlot->xAxis->setSubTickLength(0, 3);
customPlot->yAxis2->setTickLength(3, 3);
customPlot->yAxis2->setSubTickLength(1, 1);
}

文章评论